
In this article I will break down a very powerful forex trading strategy. If you master all the concepts, you will see a drastic change in your trading. However, profitable forex trading requires several factors that includes risk management, patience and discipline to name but a few. On top of this we need a strategy that gives us order of what to look for in the markets.
traders dynamic index indicator – tdi
The TDI is the only indicator that can read market volatility and sentiment at the same time. It is a powerful indicator that can signal overbought or oversold assets with ease. Firstly, lets describe the components of the TDI indicator.
components of the tdi indicator
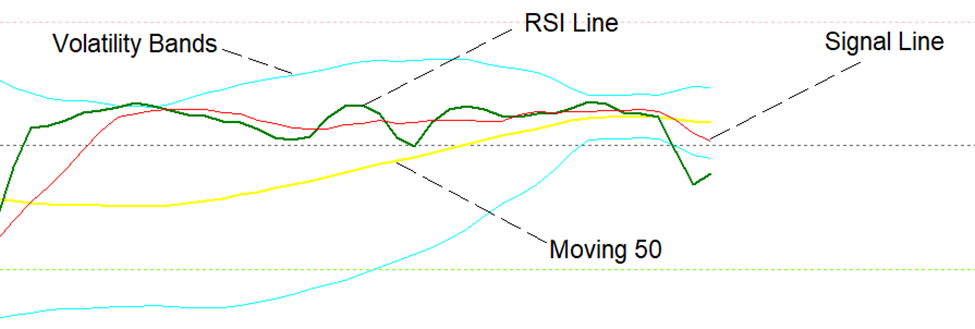
Above is a pictorial view of the TDI indicator. The main component is the volatility bands which shows the volatility of the market. The RSI line shows rise or drop of the relative strength index. The moving 50 is the boundary of the upper and lower potion of the indicator. However, the most important components for our trading strategy are the volatility bands and the RSI line. When the RSI line is on the upper side of the moving its a selling market profile where if it is on the lower side of the moving 50 its a buying market profile.
tdi shark fin
As the name of the trading strategy implies the TDI is the first indicator you need. CHECK IT IN OUR FREE TELEGRAM CHANNEL. On the TDI we need the RSI line piercing out of the volatility bands and going back inside. We call this effect shark fin. The shark fin will be observed on the four-hour timeframe (H4).
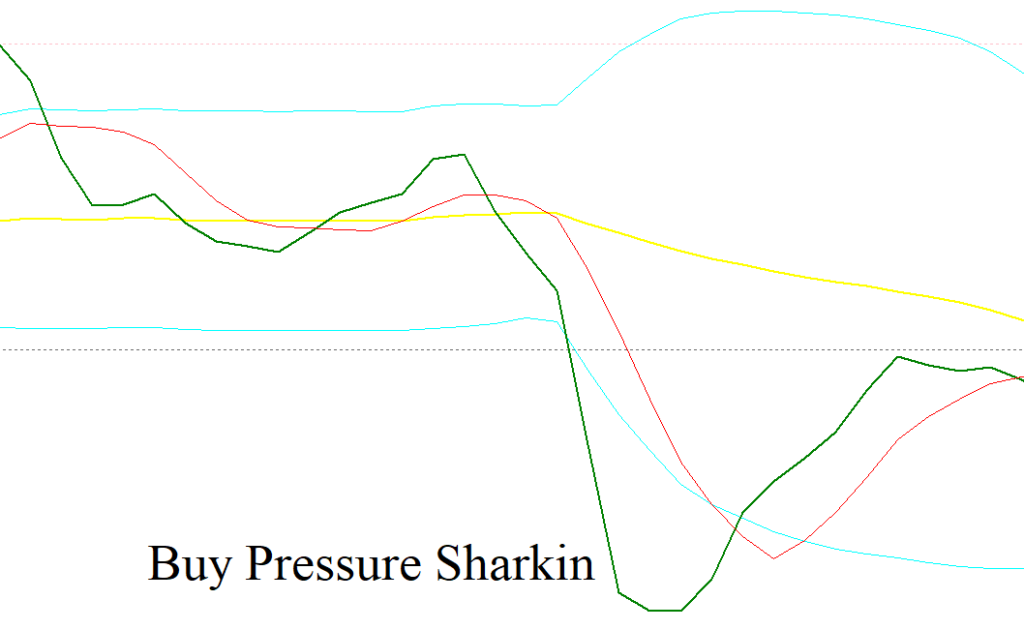
H4 Timeframe shark fin signifies that the market has set a peak formation low or a market reversal point. Please note that this will not be an entry signal but a greenlight for preparation. The next part now requires exponential moving averages or EMAs in short.
exponential moving averages (emas)
The EMAs will provide 2 things which are the point of market interest and point of market entry. We will employ 2 emas which are the period 13 exponential moving average and the period 50 exponential moving average both of them applied to close. These should look as shown below.

When an H4 ( four hour timeframe) tdi shark fin is issued, either buy pressure or sell pressure the next step is to switch to the H1 (hourly timeframe). Since we now understand that a shark fin on H4 is peak point the exponential moving averages will be there to indicate a lock of this particular point. A peak lock is seen as a 13 ema crossing a 50 ema as shown in the above image.
The easiest way to remember the sequence will be H4 Shark fin, Peak lock on H1 and the entry at 50 ema retest. At 50 ema and valid candlestick reversal pattern is required to trigger your trade.
rules for entry
See an H4 Shark fin and determine if its buying pressure or selling pressure.
Wait for 13 ema to cross 50 ema on the H1 timeframe above or below in line with the H4 shark fin.
The 50 ema is the point of market interest.
Look for any valid candlestick reversal pattern at the 50 ema and buy or sell when the candle closes.
conclusion
Basing on past data market back testing this trading strategy scored an average of 65% accuracy. As always, I advise to back test first before applying on your account. Always remember that for a strategy to work properly you need a reputable and regulated broker. My broker of choice is HFM check them out.